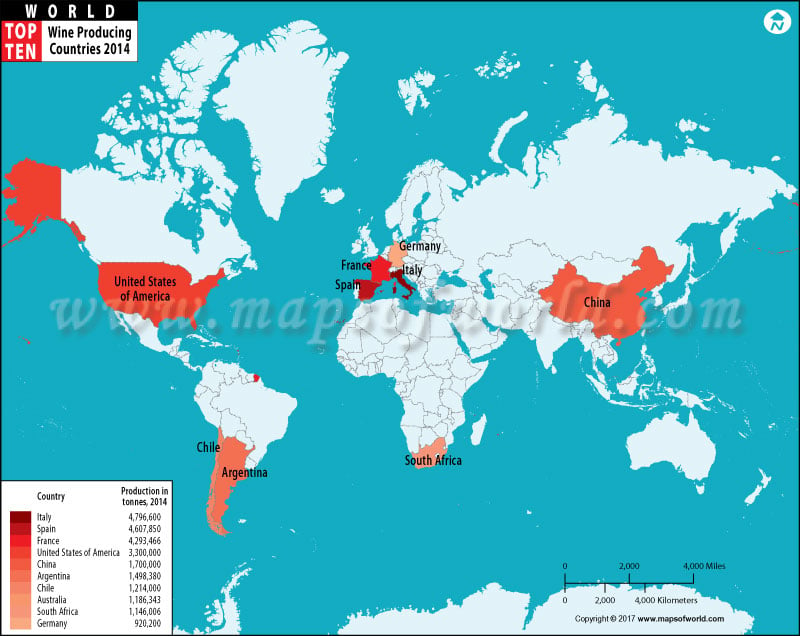
Here are the top ten wine producing countries based on data from the International Organisation of Vine and Wine (OIV) in 2021:
- Italy – 47.5 million hectoliters
- France – 43.9 million hectoliters
- Spain – 40.6 million hectoliters
- United States – 23.5 million hectoliters
- Argentina – 14.5 million hectoliters
- Chile – 12.9 million hectoliters
- Australia – 12.1 million hectoliters
- South Africa – 9.4 million hectoliters
- Germany – 8.4 million hectoliters
- China – 7.1 million hectoliters
Top Ten Wine Producing Countries 2014 |
| Rank | Country | Production in tonnes, 2014 |
|---|---|---|
| 1 | Italy | 4,796,600 |
| 2 | Spain | 4,607,850 |
| 3 | France | 4,293,466 |
| 4 | United States of America | 3,300,000 |
| 5 | China, mainland | 1,700,000 |
| 6 | China | 1,700,000 |
| 7 | Argentina | 1,498,380 |
| 8 | Chile | 1,214,000 |
| 9 | Australia | 1,186,343 |
| 10 | South Africa | 1,146,006 |
Top 50 Wine Producing Countries 2014 |
| Rank | Country | Production in tonnes, 2014 |
|---|---|---|
| 11 | Germany | 920,200 |
| 12 | Portugal | 603,327 |
| 13 | Romania | 378,283 |
| 14 | Greece | 334,300 |
| 15 | Russian Federation | 327,400 |
| 16 | New Zealand | 320,400 |
| 17 | Brazil | 273,100 |
| 18 | Hungary | 258,520 |
| 19 | Austria | 199,869 |
| 20 | Serbia | 198,183 |
| 21 | Republic of Moldova | 149,850 |
| 22 | Bulgaria | 130,500 |
| 23 | Georgia | 108,600 |
| 24 | Switzerland | 93,365 |
| 25 | Ukraine | 86,904 |
| 26 | Japan | 85,000 |
| 27 | Peru | 73,000 |
| 28 | Uruguay | 72,500 |
| 29 | Canada | 54,663 |
| 30 | Algeria | 52,000 |
| 31 | Czechia | 52,000 |
| 32 | The former Yugoslav Republic of Macedonia | 51,013 |
| 33 | Croatia | 45,272 |
| 34 | Turkey | 44,707 |
| 35 | Mexico | 39,360 |
| 36 | Turkmenistan | 39,000 |
| 37 | Morocco | 37,000 |
| 38 | Uzbekistan | 36,000 |
| 39 | Slovakia | 32,527 |
| 40 | Belarus | 29,980 |
| 41 | Kazakhstan | 21,993 |
| 42 | Tunisia | 21,500 |
| 43 | Albania | 17,500 |
| 44 | Montenegro | 16,000 |
| 45 | Lebanon | 14,700 |
| 46 | Slovenia | 13,229 |
| 47 | Colombia | 13,000 |
| 48 | Luxembourg | 12,494 |
| 49 | Cuba | 12,080 |
| 50 | Estonia | 11,104 |
Source : http://www.fao.org/faostat/en/#data/QD Data updated – FAOSTAT, 2016
Top Ten – Other Maps |
Explore More – Business and Economy |

 Top Ten Sugarcane Producing Countries in the World