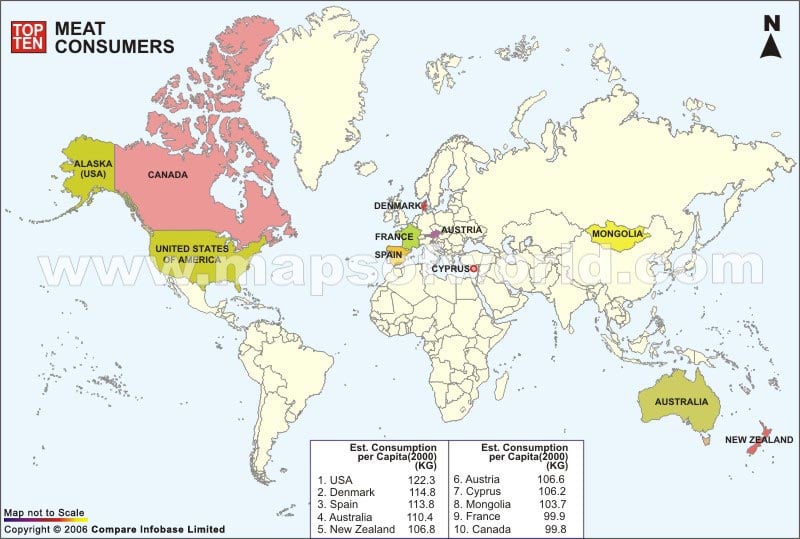
Here are the top ten meat consumer countries in the world, based on the total meat consumption per capita per year, according to data from the Food and Agriculture Organization of the United Nations (FAO) as of 2021:
- United States – 97.9 kg
- Australia – 93.9 kg
- Israel – 93.0 kg
- Argentina – 89.4 kg
- Canada – 88.4 kg
- Brazil – 83.2 kg
- Kuwait – 80.0 kg
- New Zealand – 78.2 kg
- Uruguay – 77.8 kg
- Chile – 76.0 kg
Top Ten Meat Consumer Countries 2016 |
| Rank | Country | Kilograms/capita , 2016 |
|---|---|---|
| 1 | United States | 97.1 |
| 2 | Australia | 94.8 |
| 3 | Argentina | 86.1 |
| 4 | Uruguay | 81 |
| 5 | Israel | 80.3 |
| 6 | Brazil | 77.2 |
| 7 | Chile | 71.6 |
| 8 | Canada | 70 |
| 9 | New Zealand | 67.5 |
| 10 | Russia | 59.5 |
| 11 | Korea | 55.7 |
| 12 | Malaysia | 54.2 |
| 13 | Saudi Arabia | 53.8 |
| 14 | Paraguay | 52.1 |
| 15 | Viet Nam | 52.1 |
| 16 | South Africa | 50.3 |
| 17 | China (People’s Republic of) | 50 |
| 18 | Mexico | 47.7 |
| 19 | Peru | 47.7 |
| 20 | Kazakhstan | 43.8 |
| 21 | Colombia | 43.6 |
| 22 | Ukraine | 40.4 |
| 23 | Japan | 36.2 |
| 24 | World | 34.3 |
| 25 | BRICS | 32.3 |
| 26 | Turkey | 30.3 |
| 27 | Iran | 29.5 |
| 28 | Philippines | 29.2 |
| 29 | Thailand | 22.8 |
| 30 | Egypt | 20.1 |
| 31 | Algeria | 17.3 |
| 32 | Haiti | 14.1 |
| 33 | Zambia | 13.6 |
| 34 | Pakistan | 12.8 |
| 35 | Indonesia | 11.2 |
| 36 | Ghana | 9 |
| 37 | Sub-Saharan Africa | 8.2 |
| 38 | Mozambique | 7.2 |
| 39 | Tanzania | 6.8 |
| 40 | Nigeria | 5.9 |
| 41 | Ethiopia | 4.1 |
| 42 | Bangladesh | 3.3 |
| 43 | India | 3.1 |
| 44 | Sudan | 0 |
Source :https://data.oecd.org/agroutput/meat-consumption.htm
Top Ten – Other Maps |

 Top 10 Most Visited Theme (Amusement) Parks in the World