- Brazil – 7 times (1958, 1962, 1970, 1994, 1998, 2002, 2006)
- Germany – 8 times (1954, 1966, 1974, 1982, 1986, 1990, 2002, 2014)
- Italy – 6 times (1934, 1938, 1970, 1982, 1994, 2006)
- Argentina – 5 times (1930, 1978, 1986, 1990, 2014)
- Uruguay – 3 times (1930, 1950, 1954)
- Netherlands – 3 times (1974, 1978, 2010)
- Hungary – 2 times (1938, 1954)
- Czechoslovakia – 2 times (1934, 1962)
- England – 1 time (1966)
- France – 2 times (1998, 2006)
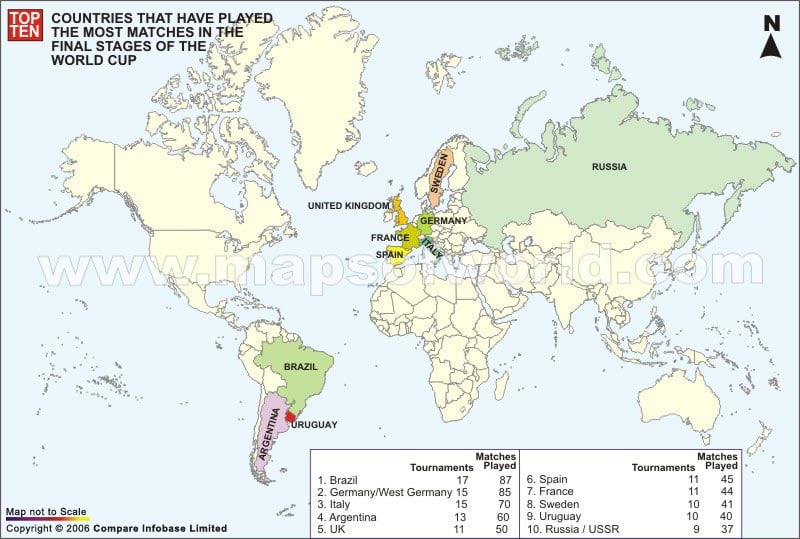
World Top Ten Countries Most Played in Football World Cup Final Matches |
|||||
| Countries | Tournaments | Matches Played | |||
| Brazil | 17 | 87 | |||
| Germany / West Germany | 15 | 85 | |||
| Italy | 15 | 70 | |||
| Argentina | 13 | 60 | |||
| UK | 11 | 50 | |||
| Spain | 11 | 45 | |||
| France | 11 | 44 | |||
| Sweden | 10 | 41 | |||
| Uruguay | 10 | 40 | |||
| Russia / USSR | 9 | 37 | |||
Top Ten – Education Maps |

 Top Ten Countries with Maximum Environment Protection Treaties