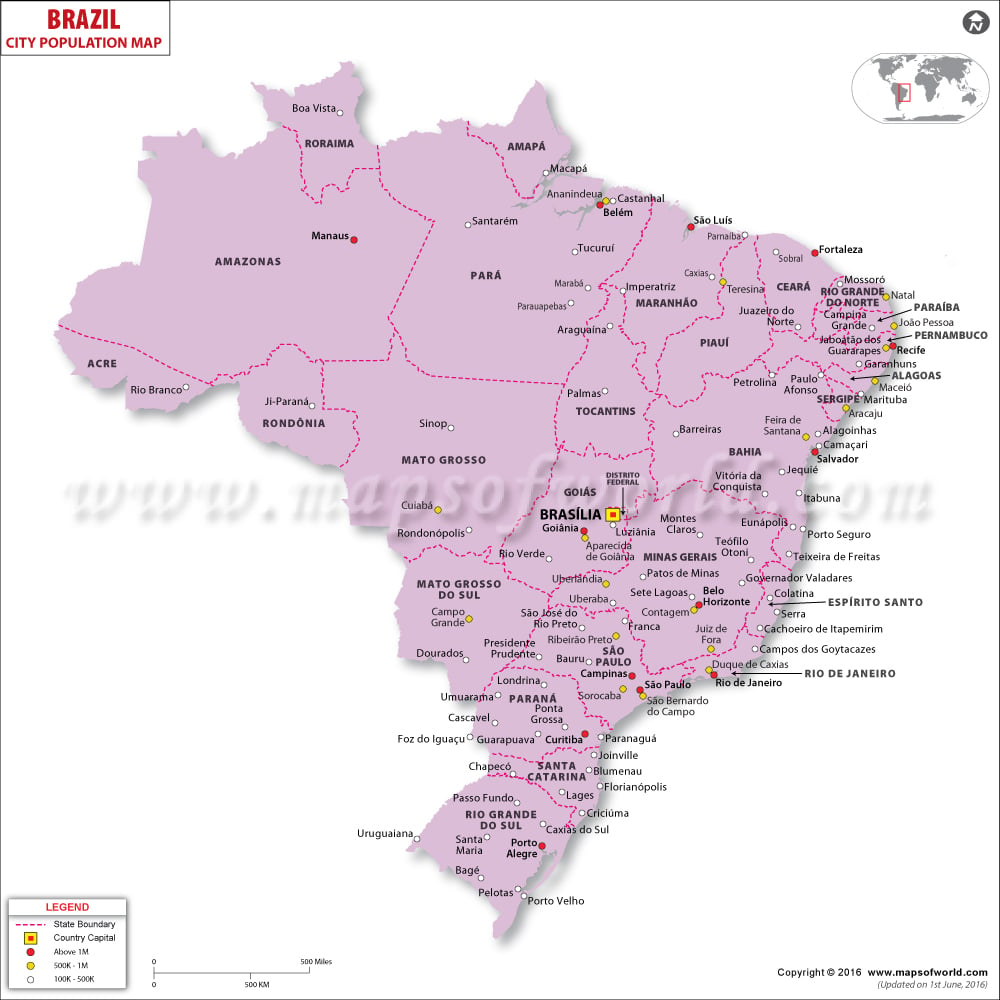
Brazil Population is assorted in nature, with unique blend of multi-cultural and multi-national features. Of the 169 million inhabitants in Brazil in 2000, there are people belonging to diverse cultures, racial groups and religious beliefs.A meager part of the Brazil Population is made up of the native aboriginals.
They comprise only 0.4% of the total population, residing throughout the Brazilian mainland, mainly in the northern, central and western parts. These Aboriginal Brazilians are direct descendents of the original inhabitants of the nation.
Diverse racial groups form a substantial part of the Brazil Population. They mainly comprise the Portuguese, African, Guarani and Tupi who migrated in large numbers to Brazilian mainland areas from 19th century onwards. In the later stages, several Europeans from Lebanon, Syria, Italy, Germany, Spain, Poland, Ukraine as well as the Japanese, Chinese and Koreans came in and settled in the country, offering it a multi-national recognition in the true sense of the term.
Brazilian Population distinguishes the local people on the basis of their skin tans and original nationality. Hence one finds that the country is full of Brazilians having Indian, European and African ancestries. Again, they are also segregated into whites and blacks depending upon their skin colors. These are handful of people who compose quite a considerable part of the national population.
The remaining part of the Brazil Population consists of foreigners like the Arabs, Germans, Poles, Dutch, Syrians, Italians, Spaniards, Lebanese and a handful of Portuguese. Either permanent settlers or temporary residents on the land, they contribute much in increasing the total head counts in Brazil.
| Year | Total population | Age 0–14 (%) | Age 15–64 (%) | Age 65+ (%) |
|---|---|---|---|---|
| 1950 | 53 975 k | 41.6 | 55.5 | 3 |
| 1955 | 62 880 k | 42 | 55 | 3 |
| 1960 | 72 759 k | 43.1 | 53.7 | 3.1 |
| 1965 | 84 389 k | 43.6 | 53 | 3.4 |
| 1970 | 96 078 k | 42.3 | 54.2 | 3.5 |
| 1975 | 108 224 k | 40.2 | 56 | 3.8 |
| 1980 | 121 712 k | 38 | 58 | 4 |
| 1985 | 136 247 k | 36.9 | 59 | 4.1 |
| 1990 | 149 650 k | 35.2 | 60.4 | 4.5 |
| 1995 | 161 848 k | 32.4 | 62.6 | 5 |
| 2000 | 174 425 k | 29.5 | 64.9 | 5.6 |
| 2005 | 185 987 k | 27.5 | 66.2 | 6.3 |
| 2010 | 194 946 k | 25.5 | 67.5 | 7 |
Population of Brazilian Cities (2013 Estinate) |
| City | Population | City | Population |
|---|---|---|---|
| São Paulo | 11,821,876 | Belém | 1,425,923 |
| Rio de Janeiro | 6,429,922 | Goiânia | 1,393,579 |
| Salvador | 2,883,672 | Guarulhos | 1,299,249 |
| Brasília | 2,789,761 | Campinas | 1,144,862 |
| Fortaleza | 2,551,805 | São Luís | 1,053,919 |
| Belo Horizonte | 2,479,175 | São Gonçalo | 1,025,507 |
| Manaus | 1,982,179 | Maceió | 996,736 |
| Curitiba | 1,848,943 | Duque de Caxias | 873,921 |
| Recife | 1,599,514 | Natal | 854 |
| Porto Alegre | 1,467,823 | Teresina | 836,474 |

 Brazil Rainforest