What were the Top 10 US States where Immigrants were Naturalized in 2018?

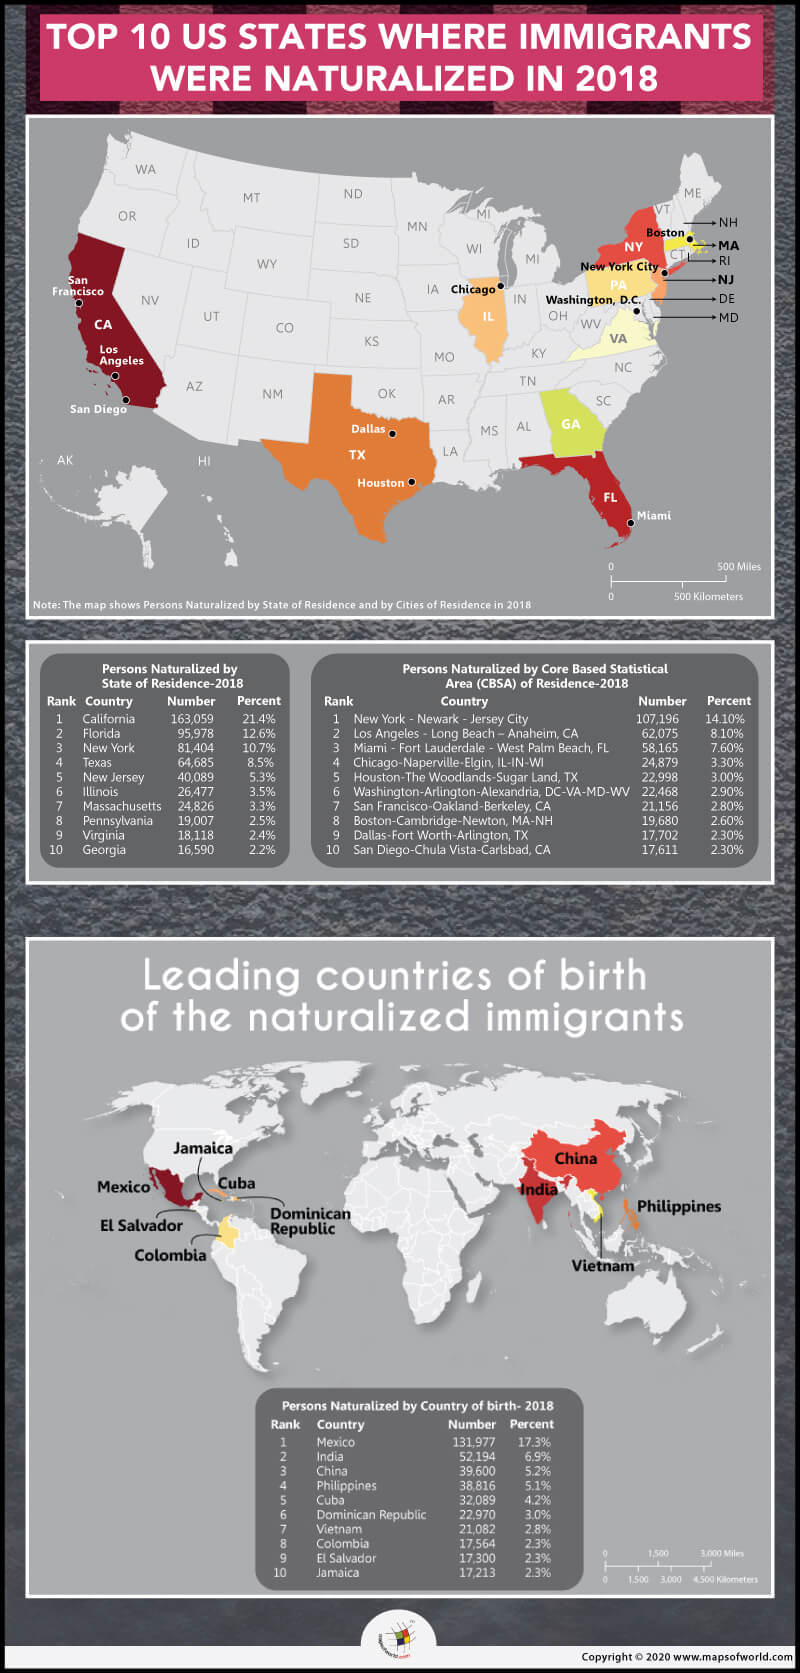
The state of California rates is high on the list of immigrants who have made the United States their home. In 2018, a total of 761,901 immigrants were naturalized in the US. Of these, California accounted for the largest number at 163,059 or 21.4 percent of the naturalized population. Florida, known as “The Sunshine State”, came in at the second spot with 95,978 or 12.6 percent. New York City occupied the third position with 81,404 or 10.7 percent.
Texas is nicknamed the “Lone Star State”, equally popular among immigrants occupying the fourth place with 64,685 or 8.5 percent. New Jersey came fifth with 40,089 immigrants or 5.3 percent. Illinois placed on the sixth spot with 26,477 or 3.5 percent.
The other states that have been popular among immigrants are Massachusetts (24,826 or 3.3 percent), Pennsylvania (19,007 or 2.5 percent), Virginia (18,118 or 2.4 percent), Georgia (16,590 or 2.2 percent). In 2018, 72 percent of all persons naturalizing resided in these ten states.
Top 10 US States where immigrants were naturalized in 2018:
| Persons Naturalized by State of Residence – 2018 | |||
| Rank | State | Number | Percentage |
| 1 | California | 163,059 | 21.40% |
| 2 | Florida | 95,978 | 12.60% |
| 3 | New York | 81,404 | 10.70% |
| 4 | Texas | 64,685 | 8.50% |
| 5 | New Jersey | 40,089 | 5.30% |
| 6 | Illinois | 26,477 | 3.50% |
| 7 | Massachusetts | 24,826 | 3.30% |
| 8 | Pennsylvania | 19,007 | 2.50% |
| 9 | Virginia | 18,118 | 2.40% |
| 10 | Georgia | 16,590 | 2.20% |
Leading Countries of Birth of New Citizens in the US in 2018
The USA is the prime destination for many people. The US foreign-born population has crossed over 40 million in 2018. Currently, immigrants account for nearly 13.7% of the US Population.
Mexico was the leading country of the US immigrant population in 2018. India and China are in the second and third spots.
Here is the list of top ten nations of birth of new citizens in 2018:
| Persons Naturalized by Country of birth – 2018 | |||
| Rank | Country | Number | Percentage |
| 1 | Mexico | 131,977 | 17.30% |
| 2 | India | 52,194 | 6.90% |
| 3 | China | 39,600 | 5.20% |
| 4 | Philippines | 38,816 | 5.10% |
| 5 | Cuba | 32,089 | 4.20% |
| 6 | Dominican Republic | 22,970 | 3.00% |
| 7 | Vietnam | 21,082 | 2.80% |
| 8 | Columbia | 17,564 | 2.30% |
| 9 | El Salvador | 17,300 | 2.30% |
| 10 | Jamaica | 17,213 | 2.30% |
Persons Naturalized by the State of Residence
The top ten metropolitan areas of residence of the naturalized immigrants were:
| Persons Naturalized by Core Based Statistical Area (CBSA) of Residence-2018 | |||
| Rank | Metropolitan Area of Residence | Number | Percentage |
| 1 | New York – Newark – Jersey City | 107,196 | 14.10% |
| 2 | Los Angeles – Long Beach – Anaheim, CA | 62,075 | 8.10% |
| 3 | Miami – Fort Lauderdale – West Palm Beach, FL | 58,165 | 7.60% |
| 4 | Chicago-Naperville-Elgin, IL-IN-WI | 24,879 | 3.30% |
| 5 | Houston-The Woodlands-Sugar Land, TX | 22,998 | 3.00% |
| 6 | Washington-Arlington-Alexandria, DC-VA-MD-WV | 22,468 | 2.90% |
| 7 | San Francisco-Oakland-Berkeley, CA | 21,156 | 2.80% |
| 8 | Boston-Cambridge-Newton, MA-NH | 19,680 | 2.60% |
| 9 | Dallas-Fort Worth-Arlington, TX | 17,702 | 2.30% |
| 10 | San Diego-Chula Vista-Carlsbad, CA | 17,611 | 2.30% |
The total naturalized immigrant was 761,901 in 2018 from the following part of the world:
| Rank | Continent/Area | Number | Percentage |
| 1 | Africa | 64,934 | 8.50% |
| 2 | Asia | 275,621 | 36.20% |
| 3 | Europe | 71,436 | 9.40% |
| 4 | North America | 277,592 | 36.40% |
| 5 | Caribbean | 95,298 | 12.50% |
| 6 | Central America | 40,815 | 5.40% |
| 7 | Other North America | 141,479 | 18.60% |
| 8 | Oceania | 3,792 | 0.50% |
| 9 | South America | 67,892 | 8.90% |
| 10 | Unknown | 634 | 0.10% |
Related Links:
