What countries are rapidly aging?
Aging is a global phenomenon and declining fertility and increasing longevity are the key drivers of population aging globally.
The United Nation’s Department of Economic and Social Affairs released a World Population Aging report in 2017 that helps to understand the global trends of aging.
According to the United Nation’s 2015 World Population Aging report titled, ‘World Population Prospects: The 2015 Revision’; in 2000, out of the ten countries that were most aged, nine were in Europe. The report reveals that in 2015, those aged above 60 accounted for a little more than 25 percent in all ten most aged countries.
In 2017, one in eight people worldwide was aged 60 or over. Global population aged 60 years or over numbered 962 million in 2017, more than twice as large as in 1980 when there were 382 million older persons worldwide. The number of older persons is expected to double again by 2050 when it is projected to reach nearly 2.1 billion.
In 2030, older persons are expected to outnumber children under age 10 (1.41 billion versus 1.35 billion). It has been estimated that by 2030, in the countries with largest aged population, those above 60 will constitute around 32 percent of their population. Europe will still be leading the race with seven of the ten most aged countries coming from that continent, while the other three would be from Asia and the Caribbean.
In 2050, projections indicate that there will be older persons aged 60 or over than adolescents and youth at ages 10-24 (2.1 billion versus 2.0 billion). In 2050, older persons are expected to account for 35 percent of the population in Europe, 28 percent in Northern America, 25 percent in Latin America and the Caribbean, 24 percent in Asia, 23 percent in Oceania and 9 percent in Africa.
As the average age of populations continues to rise, Governments should understand the importance of implementing policies to address the needs and interests of older persons, including those related to housing, employment, health care, social protection, and other forms of intergenerational solidarity. By anticipating this demographic shift, countries can proactively enact policies to adapt to an aging population, which will be essential to fulfill the pledge of the 2030 Agenda for Sustainable Development that “no one will be left behind”.
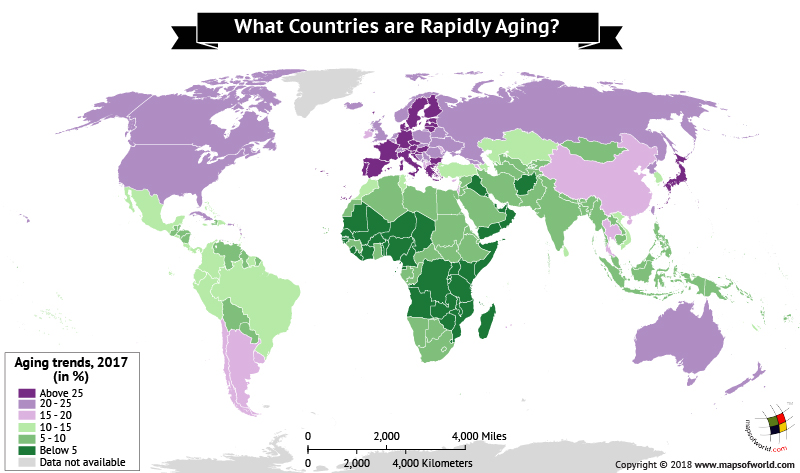
The table below provides the aging trends in 2017.
World Population Prospects for the aging trends
| Country or area | Population in 2017 aged 60 years or over (in thousands) |
Percentage aged 60 years or over |
| Japan | 42,548 | 33.4 |
| Italy | 17,427 | 29.4 |
| Germany | 22,996 | 28 |
| Portugal | 2,880 | 27.9 |
| Finland | 1,535 | 27.8 |
| Bulgaria | 1,961 | 27.7 |
| Croatia | 1,122 | 26.8 |
| Greece | 2,957 | 26.5 |
| Slovenia | 546 | 26.3 |
| Latvia | 512 | 26.2 |
| Malta | 112 | 26.1 |
| Hungary | 2,524 | 26 |
| Estonia | 339 | 25.9 |
| France | 16,719 | 25.7 |
| Martinique | 99 | 25.7 |
| Czechia | 2,714 | 25.6 |
| Sweden | 2,525 | 25.5 |
| Spain | 11,750 | 25.3 |
| Denmark | 1,451 | 25.3 |
| Lithuania | 730 | 25.3 |
| United States Virgin Islands | 27 | 25.3 |
| Austria | 2,189 | 25.1 |
| Netherlands | 4,264 | 25 |
| Romania | 4,892 | 24.9 |
| Belgium | 2,813 | 24.6 |
| Serbia | 2,153 | 24.5 |
| Channel Islands | 41 | 24.5 |
| Switzerland | 2,044 | 24.1 |
| Poland | 9,152 | 24 |
| United Kingdom | 15,849 | 23.9 |
| Guadeloupe | 106 | 23.6 |
| Canada | 8,590 | 23.5 |
| China, Hong Kong SAR | 1,727 | 23.5 |
| Bosnia and Herzegovina | 821 | 23.4 |
| Ukraine | 10,254 | 23.2 |
| Curaçao | 37 | 22.9 |
| Norway | 1,186 | 22.3 |
| Slovakia | 1,189 | 21.8 |
| United States of America | 69,774 | 21.5 |
| Belarus | 2,019 | 21.3 |
| Montenegro | 134 | 21.3 |
| Russian Federation | 30,328 | 21.1 |
| Australia | 5,124 | 21 |
| Barbados | 60 | 21 |
| New Zealand | 981 | 20.8 |
| Georgia | 815 | 20.8 |
| Puerto Rico | 747 | 20.4 |
| China, Taiwan Province of China | 4,763 | 20.2 |
| Republic of Korea | 10,264 | 20.1 |
| Cuba | 2,310 | 20.1 |
| Iceland | 67 | 20.1 |
| Luxembourg | 115 | 19.6 |
| Singapore | 1,115 | 19.5 |
| Uruguay | 675 | 19.5 |
| TFYR Macedonia | 405 | 19.5 |
| Ireland | 909 | 19.1 |
| Albania | 558 | 19 |
| Cyprus | 218 | 18.5 |
| Republic of Moldova | 712 | 17.6 |
| Thailand | 11,691 | 16.9 |
| Armenia | 496 | 16.9 |
| Mauritius | 210 | 16.6 |
| Réunion | 144 | 16.4 |
| China | 228,897 | 16.2 |
| Israel | 1,342 | 16.1 |
| China, Macao SAR | 100 | 16.1 |
| Chile | 2,894 | 16 |
| Argentina | 6,822 | 15.4 |
| Trinidad and Tobago | 206 | 15 |
| Sri Lanka | 3,109 | 14.9 |
| New Caledonia | 39 | 14.2 |
| Guam | 23 | 14 |
| Saint Lucia | 25 | 13.7 |
| Costa Rica | 669 | 13.6 |
| Jamaica | 393 | 13.6 |
| Dem. People’s Rep. of Korea | 3,436 | 13.5 |
| Bahamas | 54 | 13.5 |
| Seychelles | 13 | 13.3 |
| Brazil | 26,465 | 12.6 |
| Tunisia | 1,419 | 12.3 |
| Turkey | 9,686 | 12 |
| Lebanon | 730 | 12 |
| French Polynesia | 34 | 11.9 |
| St. Vincent and the Grenadines | 13 | 11.7 |
| Colombia | 5,716 | 11.6 |
| El Salvador | 738 | 11.6 |
| Panama | 466 | 11.4 |
| Viet Nam | 10,616 | 11.1 |
| Kazakhstan | 2,022 | 11.1 |
| Morocco | 3,807 | 10.7 |
| Ecuador | 1,739 | 10.5 |
| Grenada | 11 | 10.5 |
| Peru | 3,350 | 10.4 |
| Suriname | 58 | 10.4 |
| Dominican Republic | 1,101 | 10.2 |
| Mexico | 13,042 | 10.1 |
| Azerbaijan | 992 | 10.1 |
| Venezuela (Bolivarian Republic of) | 3,175 | 9.9 |
| Fiji | 90 | 9.9 |
| Malaysia | 3,074 | 9.7 |
| Bolivia (Plurinational State of) | 1,049 | 9.5 |
| India | 125,693 | 9.4 |
| Myanmar | 5,043 | 9.4 |
| Algeria | 3,869 | 9.4 |
| Paraguay | 643 | 9.4 |
| Iran (Islamic Republic of) | 7,148 | 8.8 |
| Nepal | 2,569 | 8.8 |
| Indonesia | 22,743 | 8.6 |
| Guyana | 67 | 8.6 |
| Samoa | 17 | 8.5 |
| Tonga | 9 | 8.5 |
| South Africa | 4,753 | 8.4 |
| Nicaragua | 521 | 8.4 |
| French Guiana | 24 | 8.4 |
| Brunei Darussalam | 34 | 8 |
| Micronesia (Fed. States of) | 8 | 8 |
| Egypt | 7,676 | 7.9 |
| Philippines | 8,023 | 7.6 |
| Uzbekistan | 2,431 | 7.6 |
| Kyrgyzstan | 459 | 7.6 |
| Bangladesh | 12,036 | 7.3 |
| Haiti | 800 | 7.3 |
| Turkmenistan | 419 | 7.3 |
| Bhutan | 59 | 7.3 |
| Cambodia | 1,129 | 7.1 |
| Honduras | 645 | 7 |
| Guatemala | 1,163 | 6.9 |
| Cabo Verde | 38 | 6.9 |
| Syrian Arab Republic | 1,246 | 6.8 |
| Pakistan | 13,259 | 6.7 |
| Lesotho | 150 | 6.7 |
| Vanuatu | 19 | 6.7 |
| Libya | 423 | 6.6 |
| Mongolia | 203 | 6.6 |
| Botswana | 146 | 6.4 |
| Gabon | 129 | 6.4 |
| Djibouti | 61 | 6.4 |
| Kiribati | 7 | 6.4 |
| Lao People’s Dem. Republic | 434 | 6.3 |
| Maldives | 28 | 6.3 |
| Belize | 23 | 6.2 |
| Papua New Guinea | 505 | 6.1 |
| Tajikistan | 520 | 5.8 |
| Mayotte | 15 | 5.8 |
| Jordan | 549 | 5.7 |
| Saudi Arabia | 1,855 | 5.6 |
| Sudan | 2,226 | 5.5 |
| Central African Republic | 255 | 5.5 |
| Namibia | 139 | 5.5 |
| Timor-Leste | 71 | 5.4 |
| Solomon Islands | 33 | 5.4 |
| Western Sahara | 30 | 5.4 |
| Ethiopia | 5,553 | 5.3 |
| Ghana | 1,533 | 5.3 |
| Eritrea | 268 | 5.3 |
| Guinea | 657 | 5.2 |
| Congo | 271 | 5.2 |
| South Sudan | 646 | 5.1 |
| Iraq | 1,920 | 5 |
| Benin | 558 | 5 |
| Mauritania | 222 | 5 |
| Rwanda | 593 | 4.9 |
| Liberia | 232 | 4.9 |
| Kuwait | 201 | 4.9 |
| Guinea-Bissau | 92 | 4.9 |
| Comoros | 40 | 4.9 |
| Mozambique | 1,436 | 4.8 |
| Madagascar | 1,225 | 4.8 |
| Côte d’Ivoire | 1,163 | 4.8 |
| Cameroon | 1,146 | 4.8 |
| Swaziland | 66 | 4.8 |
| Dem. Republic of the Congo | 3,785 | 4.7 |
| United Republic of Tanzania | 2,666 | 4.7 |
| Senegal | 741 | 4.7 |
| Yemen | 1,292 | 4.6 |
| Togo | 357 | 4.6 |
| State of Palestine | 227 | 4.6 |
| Bahrain | 69 | 4.6 |
| Nigeria | 8,568 | 4.5 |
| Somalia | 642 | 4.4 |
| Burundi | 475 | 4.4 |
| Equatorial Guinea | 56 | 4.4 |
| Kenya | 2,117 | 4.3 |
| Malawi | 793 | 4.3 |
| Sao Tome and Principe | 9 | 4.3 |
| Niger | 894 | 4.2 |
| Zimbabwe | 701 | 4.2 |
| Sierra Leone | 314 | 4.2 |
| Afghanistan | 1,462 | 4.1 |
| Angola | 1,195 | 4 |
| Mali | 735 | 4 |
| Chad | 592 | 4 |
| Oman | 185 | 4 |
| Burkina Faso | 741 | 3.9 |
| Gambia | 80 | 3.8 |
| Zambia | 630 | 3.7 |
| Uganda | 1,425 | 3.3 |
| Qatar | 74 | 2.8 |
| United Arab Emirates | 224 | 2.4 |
Know more about World health:
Related Maps:


