What is the female labor force participation rate in countries?
A striking phenomenon of recent times, is the change in the extent of women’s share in the labor force, driving employment trends and shrinking gender gaps. The assignment of gender roles and division of labor within the families begets relations of supremacy and obscurity between men and women. As noted by Engels (1972), “it was not possible for women to achieve equality with men as long as they did not take part in production.” This thought was fueled by feminist scholars that claim women’s commodification was a prerequisite for women’s liberation.
The International Labor Organization in its World Employment and Social Outlook revealed that the women labor participation rate across the globe was 48.5% in 2018, lurking behind by 26.5% to its male counterparts.Few factors attributing to such circumstances were-
• Informal Economy-
This is the time invested by women in activities not considered as ‘economic’ and that fall outside the traditional economic production boundary. As stipulated by the ILO, the goods and services produced, used for domestic consumption do not account as economic activities.
• Institutional structure-
Policy programs and women’s participation are closely linked. Women tend to work more than men but these are largely the unpaid activities like daycare work, which are not included in market work. Policies framed benefitting employed women would ensure sustainability of women labor force.
• Social issues-
Various issues pertaining to maternal health care including childbirth and period after burdens women’s time management. With the decline in maternal mortality rates, the labor participation rates have risen, correlating the two.
• Cultural Norms-
The role played by culture is a looming factor in the employment rates of women. Culture frames the regime of a nation. A welfare-state is seen as a more empowering structure to women.
In the backdrop of these facts, there has been a substantial narrowing in the gap between the employment rates of men and women, especially in the last century. Men, although still outnumber women in the labor force, the ratio is notably improving. The female labor force participation rate is defined as the ratio of females to male, in proportion, of a country’s working age population(15years-64years), that is engaged in labor market, either working or looking for work.
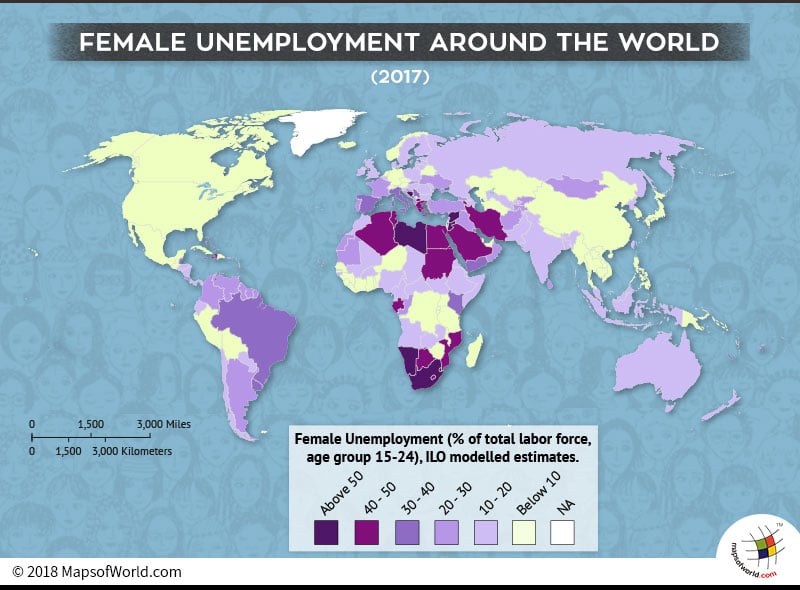
There are remarkable international variations amongst the countries owing to various social institutional and economic structures. Countries like Syria, Jordan, Libya and South Africa show the highest levels of percentage of unemployed women labor force ranging between 58%-80% (percentage of labor force). The prevailing low economic advancements and lagging educational attainments determines the low quality of employment for women in these countries.
On the other hand, countries like Niger, Cambodia, Myanmar and Nepal have a larger female labor force ranging between 0.2%-2.9%. The East and Southeast Asian nations, attributing to the rapid development in the 20th century, witnessed a larger women participation in the agriculture and manufacturing sectors. Overall, improvements in the education system have paved the way for better job opportunities.
Given below is the table depicting varying women unemployment rates prevalent across countries-
|
Country |
Percentage (2018) |
Country |
Percentage (2018) |
|
|
Syria |
80.3 |
Bangladesh |
14 |
|
|
Palestinian |
70.2 |
Trinidad and Tobago |
14 |
|
|
Libya |
67 |
Azerbaijan |
13.8 |
|
|
Jordan |
62.8 |
Nicaragua |
13.5 |
|
|
South Africa |
58.8 |
Maldives |
13.4 |
|
|
French Polynesia |
58.6 |
Bahrain |
13.3 |
|
|
Bosnia and Herzegovina |
58.4 |
Slovenia |
13 |
|
|
Eswatini |
53.8 |
Luxembourg |
12.9 |
|
|
Namibia |
53.4 |
New Zealand |
12.9 |
|
|
Saint Lucia |
50 |
Burkina Faso |
12.8 |
|
|
Macedonia |
48.7 |
Bulgaria |
12.6 |
|
|
Greece |
48.5 |
Djibouti |
12.4 |
|
|
Iran |
48.2 |
Moldova |
12.4 |
|
|
Saudi Arabia |
46.9 |
Guinea-Bissau |
12.3 |
|
|
Saint Vincent and the Grenadines |
46.1 |
Honduras |
12.3 |
|
|
Egypt |
45 |
Paraguay |
12.1 |
|
|
Lesotho |
44.1 |
Hungary |
12 |
|
|
Botswana |
42.9 |
Bhutan |
11.9 |
|
|
Gabon |
42.9 |
Eritrea |
11.9 |
|
|
Sudan |
42.9 |
Malaysia |
11.9 |
|
|
Haiti |
42.6 |
Somalia |
11.9 |
|
|
Armenia |
42.4 |
Lithuania |
11.6 |
|
|
Mozambique |
41.9 |
Ecuador |
11.5 |
|
|
Algeria |
40.8 |
India |
11.5 |
|
|
Tunisia |
40 |
Ireland |
11.5 |
|
|
New Caledonia |
39.6 |
Australia |
11.4 |
|
|
Yemen |
37.8 |
Central African Republic |
11.3 |
|
|
Serbia |
37.5 |
Vanuatu |
11.2 |
|
|
Spain |
37.5 |
Chad |
11.1 |
|
|
Italy |
37.1 |
Pakistan |
10.8 |
|
|
Jamaica |
36.7 |
Cameroon |
10.6 |
|
|
Brazil |
34.9 |
Denmark |
10.6 |
|
|
Kuwait |
34.3 |
United Kingdom |
10.6 |
|
|
Montenegro |
33.7 |
Estonia |
10.2 |
|
|
Kenya |
33.1 |
North Korea |
10.2 |
|
|
Sao Tome and Principe |
32.7 |
Taiwan |
10.2 |
|
|
Bahamas |
32.2 |
Malta |
10.1 |
|
|
Belize |
31.8 |
El Salvador |
10 |
|
|
Mauritius |
31.5 |
Ethiopia |
10 |
|
|
Brunei Darussalam |
31.1 |
Canada |
9.9 |
|
|
Barbados |
31 |
China |
9.6 |
|
|
Uruguay |
30.1 |
South Korea |
9.6 |
|
|
Sri Lanka |
28.6 |
Zimbabwe |
9.5 |
|
|
Guyana |
28.2 |
United Arab Emirates |
9.3 |
|
|
Western Sahara |
28.2 |
Norway |
8.9 |
|
|
Georgia |
28.1 |
Czech Republic |
8.8 |
|
|
Albania |
27.9 |
Guatemala |
8.8 |
|
|
Croatia |
27.5 |
Netherlands |
8.8 |
|
|
Oman |
27.1 |
Austria |
8.7 |
|
|
Suriname |
26.7 |
Comoros |
8.7 |
|
|
Fiji |
26.5 |
Philippines |
8.6 |
|
|
Argentina |
25.9 |
Malawi |
8.5 |
|
|
Costa Rica |
25.9 |
Bolivia |
8.4 |
|
|
Turkey |
25.6 |
Dominican Republic |
8.3 |
|
|
Portugal |
25.5 |
Peru |
8.3 |
|
|
Iraq |
24.4 |
Hong Kong |
8.2 |
|
|
Samoa |
24 |
Thailand |
8.1 |
|
|
Colombia |
23.8 |
Switzerland |
8 |
|
|
Mauritania |
22.6 |
Turkmenistan |
8 |
|
|
Cyprus |
22.3 |
United States |
8 |
|
|
Congo |
22 |
Democratic Republic of the Congo |
7.9 |
|
|
Lebanon |
22 |
Mexico |
7.9 |
|
|
United States Virgin Islands |
21.8 |
Israel |
7.8 |
|
|
Puerto Rico |
21.7 |
Iceland |
7 |
|
|
Tajikistan |
21.7 |
Viet Nam |
7 |
|
|
Venezuela |
21.5 |
Senegal |
5.9 |
|
|
Afghanistan |
21.2 |
Singapore |
5.9 |
|
|
Ukraine |
21.2 |
Germany |
5.8 |
|
|
France |
21.1 |
Sierra Leone |
5.7 |
|
|
Kyrgyzstan |
20.9 |
Benin |
5.6 |
|
|
Cape Verde |
20.5 |
Ghana |
5.3 |
|
|
Slovakia |
20.4 |
Kazakhstan |
5.2 |
|
|
Mongolia |
20.1 |
Cuba |
5 |
|
|
Mali |
19.4 |
Côte d’Ivoire |
4.9 |
|
|
Angola |
19.3 |
Solomon Islands |
4.7 |
|
|
Finland |
19.3 |
Tanzania |
4.7 |
|
|
Romania |
19.1 |
Guinea |
4.6 |
|
|
Chile |
18.7 |
Japan |
4.5 |
|
|
Belgium |
18 |
Tonga |
4.2 |
|
|
Timor-Leste |
17.5 |
Papua New Guinea |
4.1 |
|
|
Gambia |
17.4 |
Liberia |
4 |
|
|
Russian Federation |
17 |
Uganda |
3.7 |
|
|
Sweden |
16.9 |
Madagascar |
3.1 |
|
|
Morocco |
16.7 |
Nepal |
2.9 |
|
|
Channel Islands |
16.5 |
Rwanda |
2.6 |
|
|
Panama |
16.5 |
Macau |
2.4 |
|
|
South Sudan |
16.5 |
Togo |
2.2 |
|
|
Zambia |
15.8 |
Burundi |
1.9 |
|
|
Uzbekistan |
15.5 |
Myanmar |
1.9 |
|
|
Nigeria |
15.3 |
Qatar |
1.8 |
|
|
Poland |
15.2 |
Laos |
1.6 |
|
|
Indonesia |
15.1 |
Belarus |
1.2 |
|
|
Latvia |
14.9 |
Cambodia |
0.4 |
|
|
Guam |
14.8 |
Niger |
0.2 |
|
|
Equatorial Guinea |
14.4 |
Know more:
Related maps:


