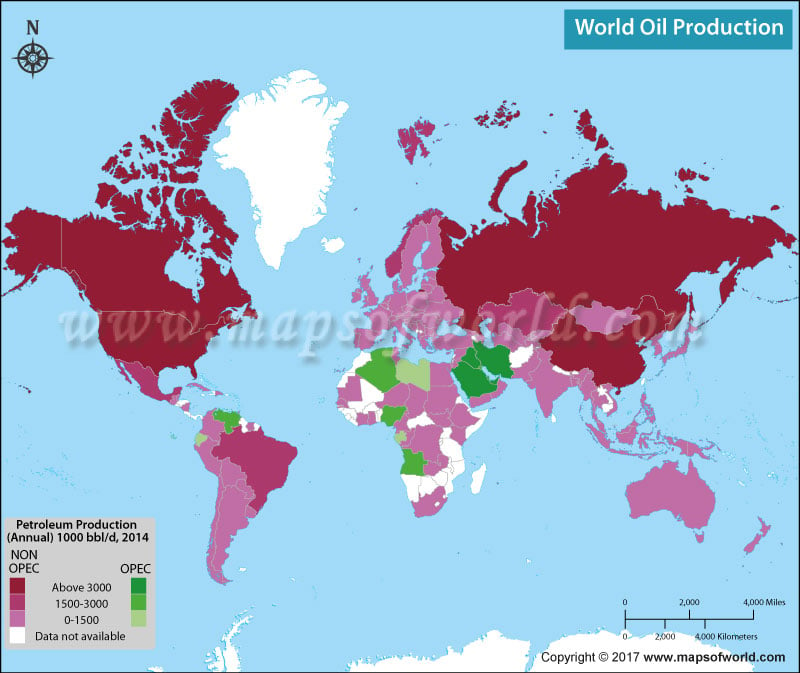
World Oil Production
The world's oil production is a crucial factor in the global economy, with countries around the world vying for the top spot in terms of output. According to the latest data, the United States is the world's largest oil producer, followed by Russia and Saudi Arabia. On the other end of the spectrum, countries such as Malta and Nicaragua produce very little oil.
The Organization of the Petroleum Exporting Countries (OPEC) is a prominent group of oil-producing nations that control a significant portion of the world's oil supply. Below is the table listing the current OPEC member countries and their oil production levels as of 2021.
| Rank | Country | Production (Barrels per Day) | % of World Production |
|---|
| 1 |
Saudi Arabia |
11,500,000 |
12.40% |
| 2 |
Iraq |
4,000,000 |
4.30% |
| 3 |
Iran |
3,500,000 |
3.80% |
| 4 |
Kuwait |
2,400,000 |
2.60% |
| 5 |
United Arab Emirates |
2,300,000 |
2.50% |
| 6 |
Venezuela |
1,200,000 |
1.30% |
| 7 |
Libya |
1,100,000 |
1.20% |
| 8 |
Nigeria |
1,000,000 |
1.10% |
| 9 |
Algeria |
900,000 |
1% |
| 10 |
Angola |
800,000 |
0.90% |
| 11 |
Congo |
300,000 |
0.30% |
| 12 |
Equatorial Guinea |
100,000 |
0.10% |
| 13 |
Gabon |
200,000 |
0.20% |
| 14 |
Iraq - Kurdistan Region |
400,000 |
0.40% |
| Total |
OPEC |
29,000,000 |
31.40% |
Apart from OPEC, there are several other countries that contribute significantly to the world's oil production. Here's a table listing those oil-producing countries:
Oil Production by Country (Non OPEC) (H3) |
|---|
| Rank | Country | Production (Barrels per Day 2021) | % of World Production |
|---|
| 1 |
United States |
11,100,000 |
18.40% |
| 2 |
Russia |
10,500,000 |
17.40% |
| 3 |
China |
3,988,000 |
6.60% |
| 4 |
Canada |
3,955,000 |
6.60% |
| 5 |
Brazil |
2,515,459 |
4.20% |
| 6 |
Mexico |
2,169,000 |
3.60% |
| 7 |
Norway |
1,647,000 |
2.70% |
| 8 |
Oman |
970,000 |
1.60% |
| 9 |
Azerbaijan |
789,000 |
0.60% |
| 10 |
India |
769,000 |
0.50% |
| 11 |
Egypt |
630,000 |
1.00% |
| 12 |
Malaysia |
610,000 |
0.50% |
| 13 |
Colombia |
494,000 |
0.80% |
| 14 |
Argentina |
447,000 |
0.20% |
| 15 |
Kazakhstan |
402,000 |
0.70% |
| 16 |
Ecuador |
397,000 |
0.70% |
| 17 |
United Kingdom |
396,000 |
0.70% |
| 18 |
Qatar |
394,000 |
0.70% |
| 19 |
Australia |
331,000 |
0.50% |
| 20 |
Thailand |
293,000 |
0.50% |
| 21 |
Vietnam |
231,000 |
0.40% |
| 22 |
Turkmenistan |
216,000 |
0.40% |
| 23 |
South Sudan |
155,000 |
0.30% |
| 24 |
Yemen |
133,000 |
0.20% |
| 25 |
Brunei |
116,000 |
0.20% |
| 26 |
Chad |
115,000 |
0.20% |
| 27 |
Denmark |
115,000 |
0.20% |
| 28 |
Romania |
105,000 |
0.20% |
| 29 |
Italy |
101,000 |
0.20% |
| 30 |
Cameroon |
85,000 |
0.10% |
| 31 |
Uzbekistan |
80,000 |
0.10% |
| 32 |
Peru |
75,000 |
0.10% |
| 33 |
Timor-Leste |
70,000 |
0.10% |
| 34 |
Trinidad and Tobago |
68,000 |
0.10% |
| 35 |
Netherlands |
51,000 |
0.10% |
| 36 |
Bahrain |
48,000 |
0.10% |
| 37 |
Papua New Guinea |
46,000 |
0.08% |
| 38 |
Turkey |
43,000 |
0.07% |
| 39 |
Tunisia |
41,000 |
0.10% |
| 40 |
Cote d'Ivoire |
34,000 |
0.05% |
| 41 |
Belarus |
32,000 |
0.05% |
| 42 |
Syria |
24,000 |
0.04% |
| 43 |
Congo, Democratic Republic |
20,000 |
0.03% |
| 44 |
Serbia |
18,000 |
0.03% |
| 45 |
Albania |
17,000 |
0.03% |
| 46 |
France |
16,000 |
0.03% |
| 47 |
Greece |
13,000 |
0.02% |
| 48 |
Bulgaria |
5,000 |
0.01% |
| 49 |
Guatemala |
5,000 |
0.01% |
| 50 |
Mauritania |
4,000 |
0.01% |
| 51 |
Georgia |
2,000 |
0.00% |
| 52 |
Kyrgyzstan |
2,000 |
0.00% |
| 53 |
Nicaragua |
2,000 |
0.00% |
| 54 |
Malta |
0 |
0% |
Related Links


