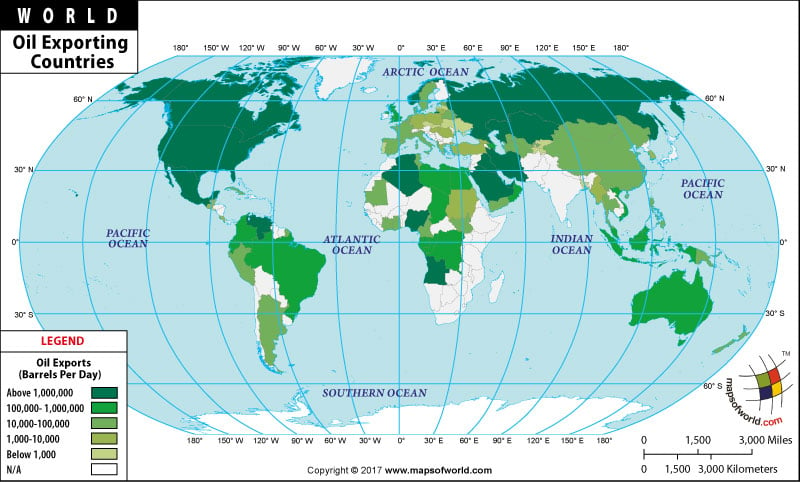
Oil Exports by Country
Oil is one of the world's most important natural resources, with many countries relying heavily on oil exports for economic growth and development.
The table below shows the oil exports of 50 significant oil-exporting countries, providing information on the amount of oil exported in barrels per day or in metric tons, the percentage of the world's total oil exports accounted for by each country, and the year in which the data was reported.
| Rank | Country | Oil Exports (bpd/tons) | Percentage of World Total | Year |
|---|
| 1 |
Saudi Arabia |
9,880,000 bpd |
11.80% |
2021 |
| 2 |
Russia |
5,490,000 bpd |
6.50% |
2021 |
| 3 |
Iraq |
3,800,000 bpd |
4.50% |
2021 |
| 4 |
United Arab Emirates |
2,770,000 bpd |
3.30% |
2021 |
| 5 |
Canada |
2,650,000 bpd |
3.10% |
2021 |
| 6 |
Kuwait |
2,360,000 bpd |
2.80% |
2021 |
| 7 |
Iran |
2,200,000 bpd |
2.60% |
2021 |
| 8 |
Venezuela |
1,380,000 bpd |
1.60% |
2021 |
| 9 |
Nigeria |
1,270,000 bpd |
1.50% |
2021 |
| 10 |
Libya |
1,240,000 bpd |
1.50% |
2021 |
| 11 |
Kazakhstan |
1,080,000 bpd |
1.30% |
2021 |
| 12 |
Qatar |
1,030,000 bpd |
1.20% |
2021 |
| 13 |
United States |
898,000 bpd |
1.10% |
2021 |
| 14 |
Angola |
874,000 bpd |
1.00% |
2021 |
| 15 |
Norway |
839,000 bpd |
1.00% |
2021 |
| 16 |
Mexico |
817,000 bpd |
1.00% |
2021 |
| 17 |
Algeria |
811,000 bpd |
1.00% |
2021 |
| 18 |
Brazil |
800,000 bpd |
0.90% |
2021 |
| 19 |
Oman |
787,000 bpd |
0.90% |
2021 |
| 20 |
China |
638,000 bpd |
0.80% |
2021 |
| 21 |
Colombia |
556,000 bpd |
0.70% |
2021 |
| 22 |
United Kingdom |
475,000 bpd |
0.60% |
2021 |
| 23 |
Equatorial Guinea |
402,000 bpd |
0.50% |
2021 |
| 24 |
Azerbaijan |
800,000 tons |
0.40% |
2020 |
| 25 |
Malaysia |
376,000 bpd |
0.40% |
2021 |
| 26 |
Congo, Republic of The |
342,000 bpd |
0.40% |
2021 |
| 27 |
Gabon |
309,000 bpd |
0.40% |
2021 |
| 28 |
Egypt |
290,000 bpd |
0.30% |
2021 |
| 29 |
Vietnam |
283,000 bpd |
0.30% |
2021 |
| 30 |
Ecuador |
278,000 bpd |
0.30% |
2021 |
| 31 |
Bahrain |
274,000 bpd |
0.30% |
2021 |
| 32 |
Thailand |
266,000 bpd |
0.30% |
2021 |
| 33 |
Syria |
253,000 bpd |
0.30% |
2021 |
| 34 |
Sudan |
245,000 bpd |
0.30% |
2021 |
| 35 |
Oman |
837,000 |
0.80% |
2019 |
| 36 |
Azerbaijan |
801,000 |
0.80% |
2019 |
| 37 |
Colombia |
746,000 |
0.70% |
2019 |
| 38 |
United Kingdom |
670,000 |
0.60% |
2019 |
| 39 |
Brazil |
619,000 |
0.60% |
2019 |
| 40 |
Congo, Republic of the |
290,000 |
0.30% |
2019 |
| 41 |
Australia |
214,000 |
0.20% |
2019 |
| 42 |
Gabon |
212,000 |
0.20% |
2019 |
| 43 |
Egypt |
124,000 |
0.10% |
2019 |
| 44 |
Vietnam |
119,000 |
0.10% |
2019 |
| 45 |
Brunei |
112,000 |
0.10% |
2019 |
| 46 |
Chad |
104,000 |
0.10% |
2019 |
| 47 |
Ghana |
103,000 |
0.10% |
2019 |
| 48 |
South Sudan |
90,000 |
0.10% |
2019 |
| 49 |
Denmark |
68,000 |
0.10% |
2019 |
| 50 |
Timor-Leste |
62,000 |
0.10% |
2019 |
Related Links
Last Updated on: April 29th, 2023


