logo


World Economy Maps


World Economy Maps
Description: Disclaimer
×

Disclaimer  :  All efforts have been made to make this image accurate. However MapSherpa, Inc, its directors and employees do not own any responsibility for the correctness or authenticity of the same.


World Economy Maps depict the various world economic growth parameters through maps. The section encompasses of maps covering world economic growth measured in terms of GDP growth, PPP and per capita income growth. This can make you easily understand World Economy maps depict countries high, low or no economic growth.

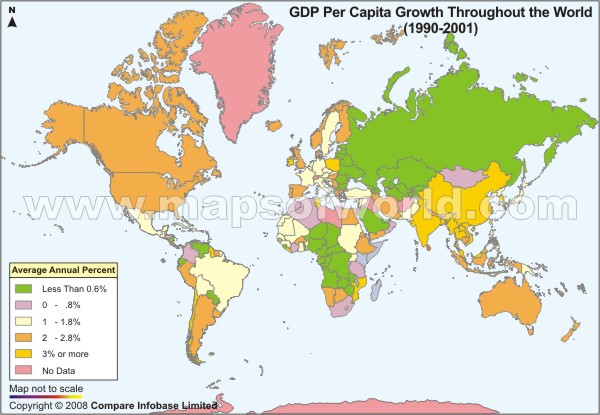
PPP(Puchasing Power Parity) takes into account the relative cost of living and the inflation rates of the countries, rather than using just exchange rates which may distort the real differences in income. The world economy grew 5.2% in 2007 powered by growth in China (11%), India (9%) and Russia (8%).GDP per capita (PPP) map shown here indicates the growth in the purchasing capacity of each individual of a country from year 1990 to 2001.

The map indicates that most of the people of South East Asia saw the maximum amount of growth in the purchasing capacity. Whereas Russia, eastern parts of Europe and western parts of Africa saw the least improvement with respect to individual purchasing capacity. The pictorial representation of World Economy maps have made such a complex subject easy to comprehend and understand even for laymen.
World Economic Statistics at a Glance
  • World GDP (PPP): $65 trillion
  • GDP Growth Rate: 5.2%
  • Growth Rate of Industrial Production: 5%
  • GDP By Sector: Services- 64% Industry- 32% Agriculture- 4%
  • GDP Per Capita (PPP): $9,774
  • Population: 6.65 billion
  • The Poor (Income below $2 per day): 3.25 billion (approximately 50%)
  • Millionaires: 9 million (approximately 0.15%)


  • Labor Force: 3.13 billion
  • Exports: $13.87 trillion
  • Imports: $13.81 trillion
  • Inflation Rate - Developed Countries: 1% - 4%
  • Inflation Rate - Developing Countries: 5% - 20%
  • Unemployment - Developed Countries: 4% - 12%
  • Unemployment & Underemployment - Developing Countries: 20% - 40%


More Maps you may want to look at
 

Economy Maps 2010


  Related Information  

Last Updated on: February 25th, 2020