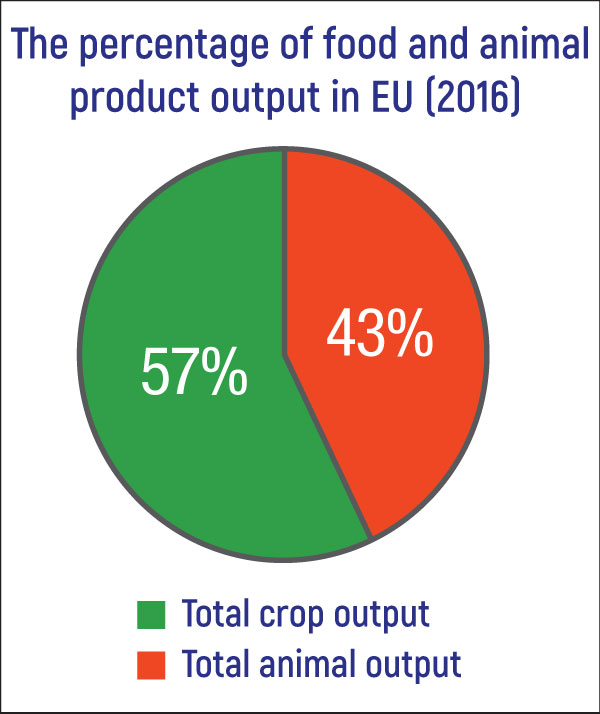
Graph representing percent of Food and Animal product output in European Union Countries
Graph representing percent of Food and Animal product output in European Union Countries
Graph representing percent of Food and Animal product output in European Union Countries
We rely on ads to keep creating quality content for you to enjoy for free.
Please support our site by disabling your ad blocker.
If the prompt is still appearing, please disable any tools or services you are using that block internet ads (e.g. DNS Servers).


Leave a Reply