What countries spend the most of their GDP on Research and Development?
The innovative activities undertaken by corporations or governments to develop new services or products or improving existing services or products are categorized under the Research and Development Industry.
A robust research and development (R&D) infrastructure is vital for the economic development of the country. With innovation and constant upgradation in technology, the wastage of time and resources is minimized and hence a powerful tool for improving productivity.
Innovation and economic growth are directly proportional to each other. More the innovation, better the way of utilizing the resources as it generates knowledge.
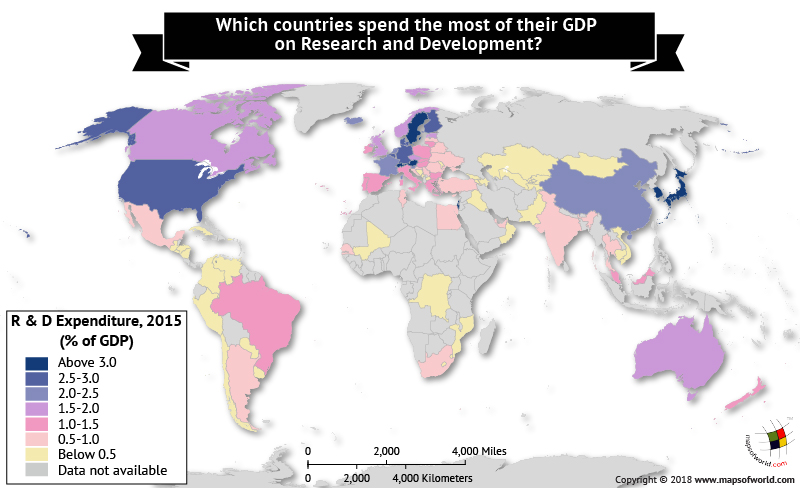
According to the 2015 World Bank report, Israel spent the maximum on research and development, amounting to 4.3% of its GDP. Multinational companies like Intel, Apple, and Facebook have their R&D centers in Israel that help the country to grab the top position on the list.
South Korea is the next to spend the maximum amount of its GDP on research and development. As per the report, the nation, which has carved a niche around the world due to its range of highly innovative and well-designed products, spent around 4.2 percent of its GDP on research and development in 2015.
The Asian nation of Japan and the three European nations of Sweden, Austria, and Denmark also spent a considerable amount of 3 percent and above.
Japan, which has set a benchmark in technological innovation and creates products which are loved worldwide, was at the third spot spending some 3.3 percent of its GDP on research and development.
Here is a table representing the countries’ expenditure on Research and Development as per World Bank Report.
| Country Name | 2015(% GDP) |
| Israel | 4.3 |
| Korea, South | 4.2 |
| Japan | 3.3 |
| Sweden | 3.3 |
| Austria | 3.1 |
| Denmark | 3.0 |
| Finland | 2.9 |
| Germany | 2.9 |
| North America | 2.8 |
| United States of America | 2.8 |
| Belgium | 2.5 |
| France | 2.2 |
| Iceland | 2.2 |
| Slovenia | 2.2 |
| China | 2.1 |
| Netherlands | 2.0 |
| Czech Republic | 1.9 |
| Norway | 1.9 |
| United Kingdom | 1.7 |
| Estonia | 1.5 |
| Hungary | 1.4 |
| Italy | 1.3 |
| Malaysia | 1.3 |
| Luxembourg | 1.3 |
| Portugal | 1.3 |
| Spain | 1.2 |
| Slovakia | 1.2 |
| Lithuania | 1.0 |
| Poland | 1.0 |
| Greece | 1.0 |
| Bulgaria | 1.0 |
| Serbia | 0.9 |
| United Arab Emirates | 0.9 |
| Croatia | 0.9 |
| Malta | 0.8 |
| Hong Kong | 0.8 |
| Egypt | 0.7 |
| Tunisia | 0.6 |
| India | 0.6 |
| Thailand | 0.6 |
| Latvia | 0.6 |
| Ukraine | 0.6 |
| Mexico | 0.6 |
| Belarus | 0.5 |
| Romania | 0.5 |
| Cyprus | 0.5 |
| Macedonia | 0.4 |
| Puerto Rico | 0.4 |
| Cuba | 0.4 |
| Chile | 0.4 |
| Montenegro | 0.4 |
| Moldova | 0.4 |
| Mozambique | 0.3 |
| Georgia | 0.3 |
| Armenia | 0.3 |
| Oman | 0.2 |
| Pakistan | 0.2 |
| Colombia | 0.2 |
| Azerbaijan | 0.2 |
| Bermuda | 0.2 |
| Bosnia and Herzegovina | 0.2 |
| Uzbekistan | 0.2 |
| Kazakhstan | 0.2 |
| Mongolia | 0.2 |
| Macao | 0.1 |
| El Salvador | 0.1 |
| Paraguay | 0.1 |
| Kyrgyzstan | 0.1 |
| Cambodia | 0.1 |
| Peru | 0.1 |
| Tajikistan | 0.1 |
| Nicaragua | 0.1 |
| Lesotho | 0.1 |
| Iraq | 0.0 |
| Aruba | NA |
| Afghanistan | NA |
| Angola | NA |
| Albania | NA |
| Andorra | NA |
| Argentina | NA |
| American Samoa | NA |
| Antigua and Barbuda | NA |
| Australia | NA |
| Burundi | NA |
| Benin | NA |
| Burkina Faso | NA |
| Bangladesh | NA |
| Bahrain | NA |
| Bahamas | NA |
| Belize | NA |
| Bolivia | NA |
| Brazil | NA |
| Barbados | NA |
| Brunei | NA |
| Bhutan | NA |
| Botswana | NA |
| Central African Republic | NA |
| Canada | NA |
| Switzerland | NA |
| Channel Islands | NA |
| Cote d’Ivoire | NA |
| Cameroon | NA |
| Democratic Republic of the Congo | NA |
| Republic of the Congo | NA |
| Comoros | NA |
| Cabo Verde | NA |
| Costa Rica | NA |
| Curacao | NA |
| Cayman Islands | NA |
| Djibouti | NA |
| Dominica | NA |
| Dominican Republic | NA |
| Algeria | NA |
| Ecuador | NA |
| Eritrea | NA |
| Ethiopia | NA |
| Fiji | NA |
| Faroe Islands | NA |
| Federated States of Micronesia | NA |
| Gabon, The | NA |
| Ghana | NA |
| Gibraltar | NA |
| Guinea | NA |
| Gambia, The | NA |
| Guinea-Bissau | NA |
| Equatorial Guinea | NA |
| Grenada | NA |
| Greenland | NA |
| Guatemala | NA |
| Guam | NA |
| Guyana | NA |
| Honduras | NA |
| Haiti | NA |
| Indonesia | NA |
| Isle of Man | NA |
| Ireland | NA |
| Iran | NA |
| Jamaica | NA |
| Jordan | NA |
| Kenya | NA |
| Kiribati | NA |
| St. Kitts and Nevis | NA |
| Kuwait | NA |
| Laos | NA |
| Lebanon | NA |
| Liberia | NA |
| Libya | NA |
| St. Lucia | NA |
| Liechtenstein | NA |
| Sri Lanka | NA |
| Lower middle income | NA |
| St. Martin | NA |
| Morocco | NA |
| Monaco | NA |
| Madagascar | NA |
| Maldives | NA |
| Marshall Islands | NA |
| Mali | NA |
| Myanmar | NA |
| Northern Mariana Islands | NA |
| Mauritania | NA |
| Mauritius | NA |
| Malawi | NA |
| Namibia | NA |
| New Caledonia | NA |
| Niger | NA |
| Nigeria | NA |
| Nepal | NA |
| Nauru | NA |
| New Zealand | NA |
| Panama | NA |
| Philippines | NA |
| Palau | NA |
| Papua New Guinea | NA |
| Korea, Dem. People’s Rep. | NA |
| Palestine | NA |
| French Polynesia | NA |
| Qatar | NA |
| Rwanda | NA |
| Saudi Arabia | NA |
| Sudan | NA |
| Senegal | NA |
| Singapore | NA |
| Solomon Islands | NA |
| Sierra Leone | NA |
| San Marino | NA |
| Somalia | NA |
| South Sudan | NA |
| Sao Tome and Principe | NA |
| Suriname | NA |
| Swaziland | NA |
| Sint Maarten | NA |
| Seychelles | NA |
| Syrian Arab Republic | NA |
| Turks and Caicos Islands | NA |
| Chad | NA |
| Togo | NA |
| Turkmenistan | NA |
| Timor-Leste | NA |
| Tonga | NA |
| Trinidad and Tobago | NA |
| Turkey | NA |
| Tuvalu | NA |
| Tanzania | NA |
| Uganda | NA |
| Uruguay | NA |
| St. Vincent and the Grenadines | NA |
| Venezuela | NA |
| British Virgin Islands | NA |
| Virgin Islands (U.S.) | NA |
| Vietnam | NA |
| Vanuatu | NA |
| Samoa | NA |
| Kosovo | NA |
| Yemen | NA |
| South Africa | NA |
| Zambia | NA |
| Zimbabwe | NA |
Know more about the World Index:
Related Maps:


