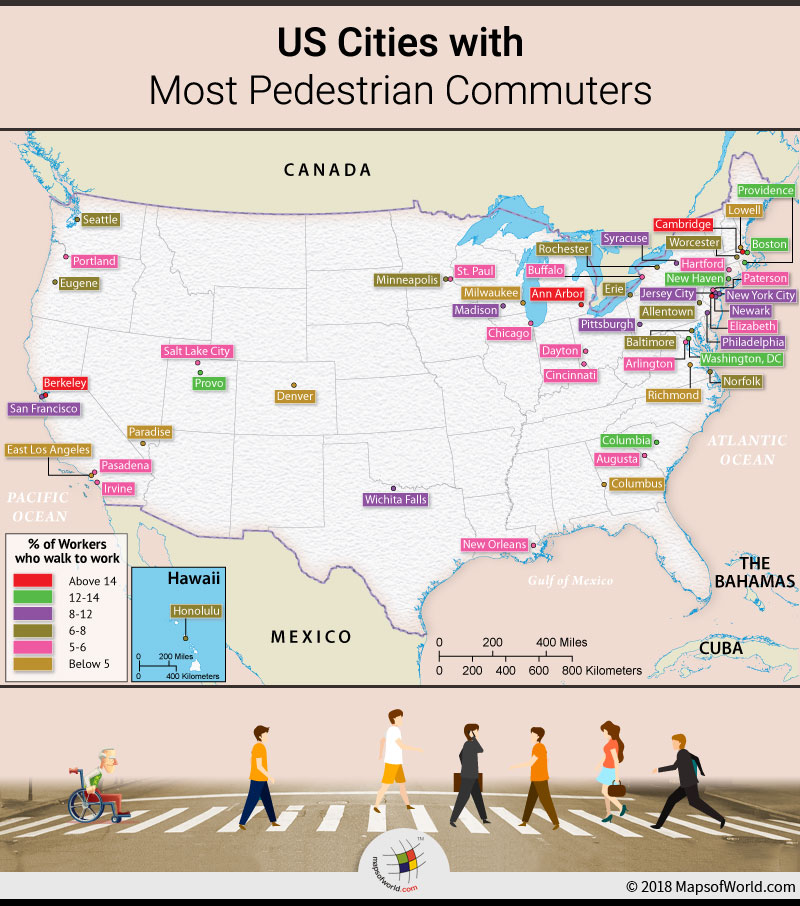
What US cities have most pedestrian commuters?
In the old days, walking or riding horses was the only way to commute. No doubt, people were healthier and exercise was itself a part of the routine. People did not indulge in heavy workouts in the gym to maintain a good physique. Whereas, in today’s world, most people have to try to stay healthy.
When you are traveling in a vehicle and stuck in traffic jams on your way to work, it affects both your physical and mental health. In fact, driving is considered to be the most stressful way to commute. On the other hand, while walking to work might not be a feasible option for most people living in cities, but it benefits your health the most.
Since people prefer other transportation modes, walking has become a very important part of national conversation regarding global transportation. Obesity rates are on the rise worldwide, and the United States has the highest percentage. It’s time for people to rethink their commuting choices, and invest ample time in physical exercise. Walking doesn’t need any special equipment, or any training. It can easily fit in your schedule during any time of the day. If weight loss isn’t your goal, walking still offers many benefits. It lowers the risk of heart diseases, high blood pressure, high cholesterol, and strengthens bones and muscles. It also rejuvenates your mood and improves your overall health.
The US Census Bureau conducts a survey (ACS Survey), which is one of the most expansive sources of information on commuting and biking in the country. Highest percentage of pedestrian commuters are in college towns or cites with military bases, as they are housed near their work stations. The city of Cambridge in Massachusetts recorded that 25.76 percentage of people use walking as a mode of transportation. You may notice, that even though it is the highest percentage amid all US cities, the number is still quite low. Next is, Ann Arbor in Michigan with 16.52 percentage of people walking to their work place.
Here is a list of cities where people prefer to walk over other transportation modes:
| City | % of workers who walk to work | City | % of workers who walk to work | |
| Cambridge, Massachusetts | 25.76% | Erie, Pennsylvania | 6.70% | |
| Ann Arbor, Michigan | 16.52% | Rochester, New York | 6.65% | |
| Berkeley, California | 15.99% | Eugene, Oregon | 6.43% | |
| New Haven, Connecticut | 14.00% | Paterson, New Jersey | 5.97% | |
| Columbia, South Carolina | 13.78% | Hartford, Connecticut | 5.89% | |
| Provo, Utah | 13.39% | Chicago, Illinois | 5.80% | |
| Boston, Massachusetts | 13.36% | Arlington, Virginia | 5.77% | |
| Providence, Rhode Island | 12.56% | Cincinnati, Ohio | 5.61% | |
| Washington, D.C. | 12.27% | St. Paul, Minnesota | 5.58% | |
| Madison, Wisconsin | 10.99% | Pasadena, California | 5.51% | |
| New York City, New York | 10.72% | Portland, Oregon | 5.47% | |
| Syracuse, New York | 10.31% | Buffalo, New York | 5.43% | |
| Pittsburgh, Pennsylvania | 10.02% | Dayton, Ohio | 5.37% | |
| San Francisco, California | 9.82% | New Orleans, Louisiana | 5.35% | |
| Wichita Falls, Texas | 9.29% | Augusta, Georgia | 5.13% | |
| Philadelphia, Pennsylvania | 9.22% | Salt Lake City, Utah | 5.07% | |
| Jersey City, New Jersey | 8.17% | Irvine, California | 5.06% | |
| Newark, New Jersey | 8.03% | Elizabeth, New Jersey | 5.00% | |
| Seattle, Washington | 7.72% | Paradise, Nevada | 4.80% | |
| Allentown, Pennsylvania | 7.55% | Milwaukee, Wisconsin | 4.79% | |
| Baltimore, Maryland | 7.28% | Columbus, Georgia | 4.78% | |
| Worcester, Massachusetts | 7.11% | Lowell, Massachusetts | 4.63% | |
| Norfolk, Virginia | 7.05% | East Los Angeles, California | 4.61% | |
| Minneapolis, Minnesota | 6.85% | Richmond, Virginia | 4.54% | |
| Honolulu, Hawaii | 6.80% | Denver, Colorado | 4.51% |
Know more:
Related Maps:


