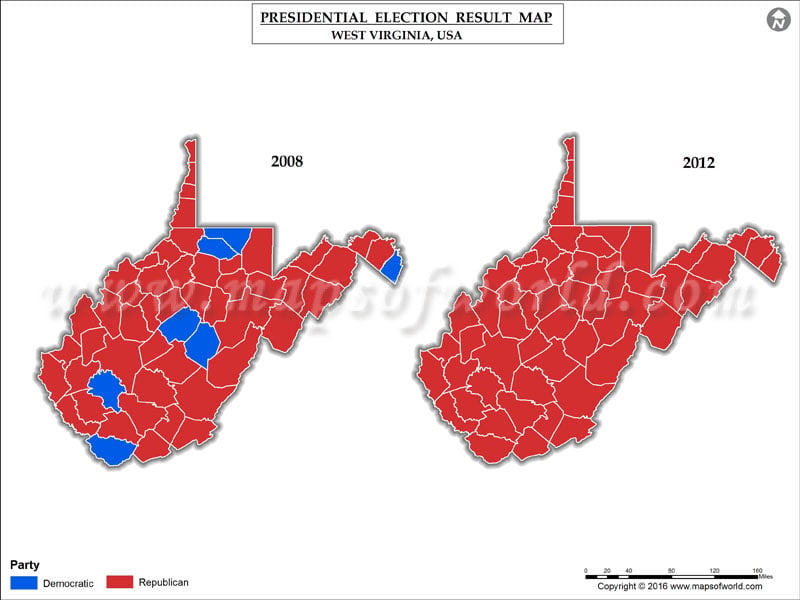
West Virginia map showing party wise Presidential Election Results of 2008 and 2012.
US presidential election in West Virginia, 2012
Party
Candidate
Running mate
Votes
Percentage
Electoral votes
Republican
Mitt Romney
Paul Ryan
417655
62.30%
5
Democratic
Barack Obama
Joe Biden
238269
35.54%
0
Libertarian
Gary Johnson
Jim Gray
6302
0.94%
0
Mountain (Green)
Jill Stein
Cheri Honkala
4406
0.66%
0
No Affiliation
Randall Terry
NA
3806
0.57%
0
Totals
670438
100.00%
5
US presidential election in West Virginia, 2008
Party
Candidate
Running mate
Votes
Percentage
Electoral votes
Republican
John McCain
Sarah Palin
397466
55.60%
5
Democratic
Barack Obama
Joe Biden
303857
42.51%
0
Independent
Ralph Nader
Matt Gonzalez
7219
1.01%
0
Constitution
Chuck Baldwin
Darrell Castle
2465
0.34%
0
Green
Cynthia McKinney
Rosa Clemente
2355
0.33%
0
Write-ins
Write-ins
NA
89
0.01%
0
Totals
713451
100.00%
5
Delegate count for each candidate in the West Virginia primaries/caucuses
Delegates Republican Party 030
Ted Cruz Donald Trump John Kasich 01234
Delegates Democratic Party 111616
Hillary Clinton Bernie Sanders Bernie SuperD Hillary SuperD 01020
Republicans
Candidates
Total Votes
% Votes
Del.
Ted Cruz
17151
9
0
Donald Trump
145959
76.8
3
John Kasich
13079
6.9
0
Democrats
Candidates
Total Votes
% Votes
Del.
Hillary Clinton
83453
36
11
Bernie Sanders
117090
51.4
16
Bernie SuperD
0
0
1
Hillary SuperD
0
0
6
West Virginia Presidential Election Results Map 2004 Vs 2008