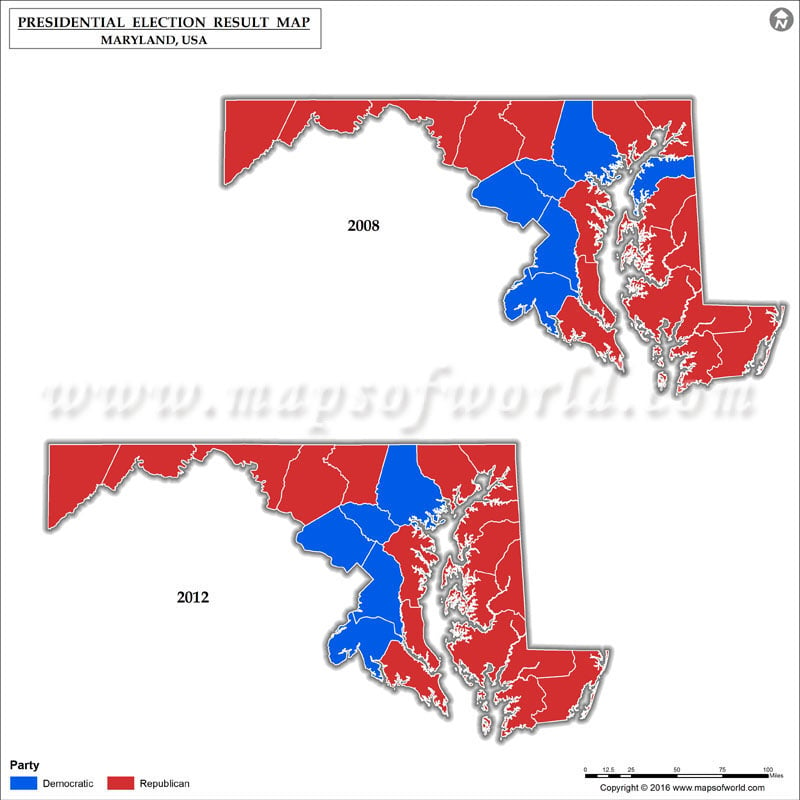
Maryland map showing party wise Presidential Election Results of 2008 and 2012.
US presidential election in Maryland, 2012
| Party |
Candidate |
Running mate |
Votes |
Percentage |
Electoral votes |
| Democratic |
Barack Obama |
Joe Biden |
1677844 |
61.97% |
10 |
| Republican |
Mitt Romney |
Paul Ryan |
971869 |
35.90% |
0 |
| Libertarian |
Gary Johnson |
Jim Gray |
30195 |
1.12% |
0 |
| Green |
Jill Stein |
Cheri Honkala |
17110 |
0.63% |
0 |
| Others |
NA |
NA |
10309 |
0.38% |
0 |
|
|
Totals |
2707327 |
100.00% |
10 |
US presidential election in Maryland, 2008
| Party |
Candidate |
Running mate |
Votes |
Percentage |
Electoral votes |
| Democratic |
Barack Obama |
Joe Biden |
1629467 |
61.92% |
10 |
| Republican |
John McCain |
Sarah Palin |
959862 |
36.47% |
0 |
| Independent |
Ralph Nader |
Matt Gonzalez |
14713 |
0.56% |
0 |
| Libertarian |
Bob Barr |
Wayne Allyn Root |
9842 |
0.44% |
0 |
| Independent |
Write-in candidates |
NA |
9043 |
0.34% |
0 |
| Green |
Cynthia McKinney |
Rosa Clemente |
4747 |
0.18% |
0 |
| Constitution |
Chuck Baldwin |
Darrell Castle |
3760 |
0.14% |
0 |
| America’s Independent |
Alan Keyes (write-in) |
Brian Rohrbough |
103 |
0.00% |
0 |
| Unaffiliated |
Donald Kenneth Allen (write-in) |
Christopher Borcik |
17 |
0.56% |
0 |
| Democratic |
Blaine Taylor (write-in) |
NA |
12 |
0.00% |
0 |
| Socialist USA |
Brian Moore (write-in) |
Stewart Alexander |
10 |
0.00% |
0 |
|
|
Totals |
2631596 |
100.00% |
10 |
Delegate count for each Candidate in the Maryland primaries/caucuses
Delegates Republican Party 0380
Ted Cruz Donald Trump John Kasich 010203040
Delegates Democratic Party 5934
Hillary ClintonBernie Sanders 020406080
| Candidates |
Total Votes |
% Votes |
Del. |
| Ted Cruz |
82038 |
18.88 |
0 |
| Donald Trump |
236623 |
54.45 |
38 |
| John Kasich |
100089 |
23.03 |
0 |
| Candidates |
Total Votes |
% Votes |
Del. |
| Hillary Clinton |
533247 |
63.03 |
59 |
| Bernie Sanders |
281275 |
33.25 |
34 |
Map of Maryland Presidential Election Results 2004
Map of Maryland Presidential Election Results 2008
US presidential election in Maryland, 2004
| Party |
Candidate |
Running mate |
Votes |
Percentage |
Electoral votes |
| Democratic Party |
John Kerry |
John Edwards |
1334493 |
55.90% |
10 |
| Republican Party |
George W. Bush (Inc.) |
Dick Cheney |
1024703 |
42.90% |
0 |
| Populist Party[7] |
Ralph Nader |
Peter Camejo |
11854 |
0.50% |
0 |
| Libertarian Party |
Michael Badnarik |
Richard Campagna |
6094 |
0.30% |
0 |
| Green Party |
David Cobb |
Patricia LaMarche |
3632 |
0.20% |
0 |
| Constitution Party |
Michael Peroutka |
Chuck Baldwin |
3421 |
0.10% |
0 |
| Write Ins |
NA |
NA |
2481 |
0.10% |
0 |
|
|
Totals |
2386678 |
100.00% |
10 |

